20 minutes, 150 words at least.
Answer:
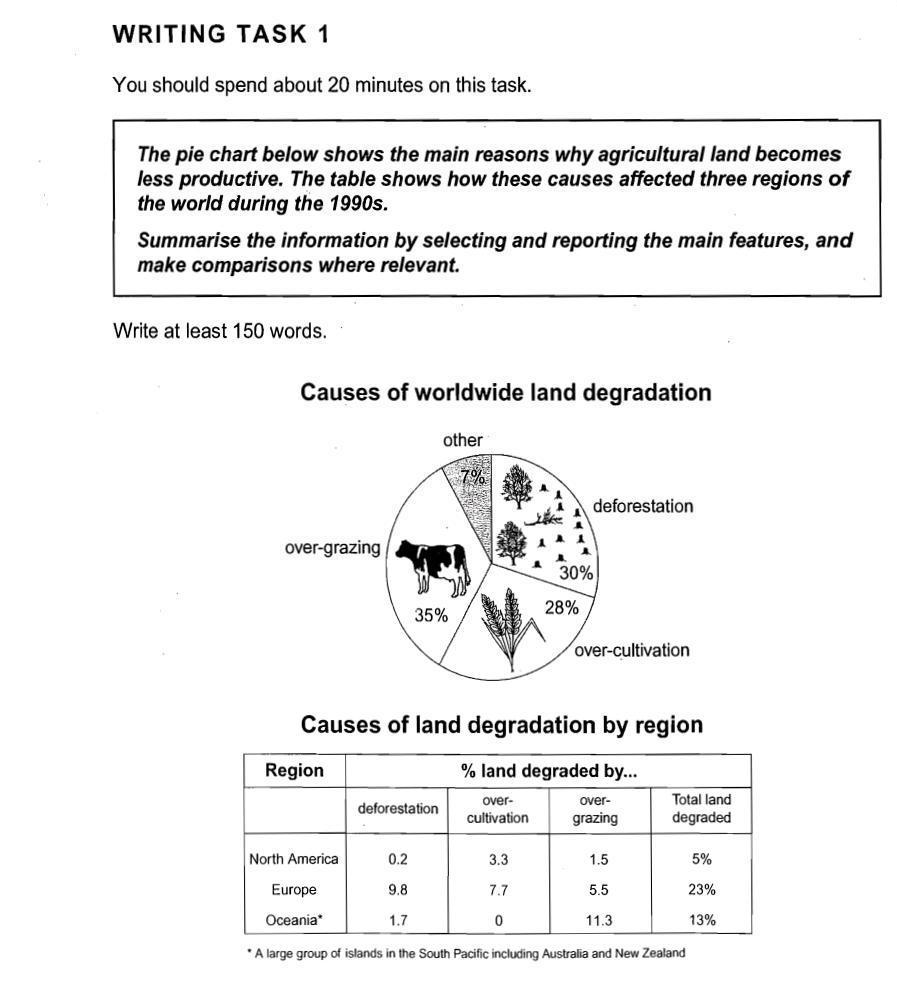
The given pie chart illustrates the contributing factors of global land destruction. The table below describes how the percentage of land degraded by these factors disturbed (this word does not convey any clear meaning) North America,, Europe and Oceania in the 1990s.
Overall, over-grazing caused just over one-third of the world’s total land destruction. Europe was the most affected region followed by Oceania.
Three main factors, namely, over-grazing, deforestation, and over-cultivation, mostly caused the damage to the agricultural land, namely, over-grazing, deforestation, and over-cultivation. The largest contributing factor was over-grazing which stood at 35% percent. The next two causes were deforestation and over-cultivation which amounted to 30% and 28% respectively.
Clearly, the land of Europe was degraded the most the largest percentage of land degradation was in Europe, which is was almost double that of Oceania and just under five times that of North America. Out of 23% of degraded land of Europe, 9.8% was due to deforestation (I can see numbers. But not main features. Most of the productivity loss in Europe was caused by deforestation followed by over-cultivation. In North America the principal cause was over-cultivation and in Oceania it was over-grazing.). In contrast, the rest of the regions were minimally affected by deforestation. In Oceania, over-grazing damaged 11.3% of the land out of 13% but over-cultivation did no damage (Numbers but not trends and main features).
Follow this blog and like our Facebook page to learn exciting new essays and cue cards. You can contact me HERE.
Please subscribe to my Youtube Channel.
Contact me for writing polished and effective Statement of Purpose.
Contact me for Editing Services and Document Writing Services.

