IELTS Academic Task 1 Correction: Fish Imported in The United States
The pie charts and table give information about the total value and source of fish imported to the United States between 1988 and 2000.
Summarise the information by selecting and reporting the main features and make comparisons where relevant.
20 minutes, 150 words at least.
Answer: Please read the sample answer HERE.
The table and pie charts present the amount of money United States spent in purchasing fishes fish (plural of fish is fish.) from various nations over the period of 12 years from 1988 to 2000. (Please note that the table and the pie-charts do not provide the same information. Please mention them differently. Read the sample answer.)
Overall, the spending went on importing fishes the fish (the monetary value of fish imports) had increased during this period and the contribution of countries in fish supply to the US changed significantly. (Wrong tense: Past perfect tense.)
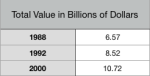
According to the table, the United States purchased the fish of worth 6.57 billion dollars of fish globally and this amount rose by almost 2 billion dollars in the next four years and kept on rising and further reached the figure of over 10 billion dollars by 2000. (Please note: purchasing is different from importing. Purchase can be domestic as well as international. Imports, on the other hand, are always global. If you’re using purchase, please use “purchase from other countries”.)
The above paragraph merely states numbers. Please mention the MAIN FEATURES and not numbers. Can you see something special? Watch the video.
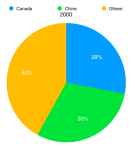
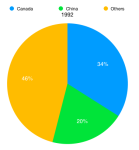
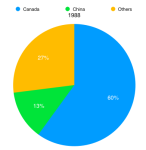
The pie charts revealed that majority of fish the greatest proportion of fish was bought from Canada, accounted for 60% of the total and this proportion fell to roughly half in 1992 and 2000. (Wrong quantifier: Majority of = countable. fish = uncountable.)
By contrast, the contribution of China in the U.S fish market uplifted (increased) significantly from 13% (percent) to 20% in 1992 and further rose by 10% in 2000. Interestingly, the import of fishes fish through remaining countries increased dramatically during the mentioned (given) period. In 1988, almost a quarter of the total expenditure on imports were from the remaining nations collectively (remaining includes collectively) and this percentage jumped (drastically increased – trend) by precisely 20% (20 is already precise) after during the next 4 years but in subsequent years it declined slightly (marginally) by 6%.
(You’ve not noticed the trends showing the nature of increase and decrease in the pie-charts.)
Follow this blog and like our Facebook page to learn exciting new IELTS essays and cue cards. You can contact me HERE.
Please subscribe to my Youtube Channel.
Contact me for writing a polished and effective Statement of Purpose.
Contact me for Editing Services and Document Writing Services or help with your IELTS