
Changes in Average House Prices in Five Different Cities
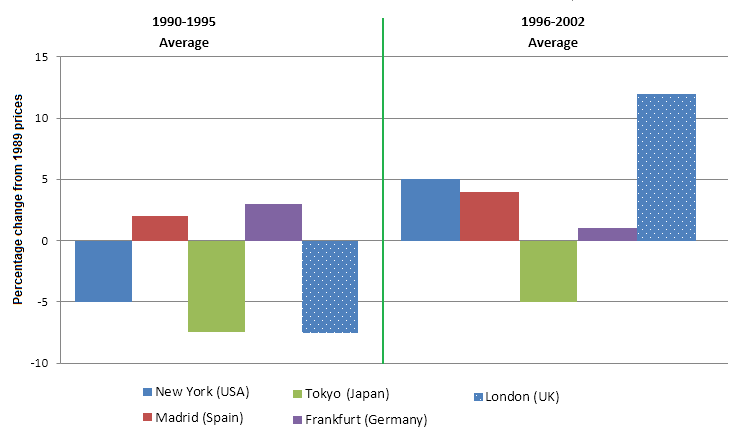
The chart below shows information about changes in average house prices in five different cities between 1990 and 2002 compared with the average house prices in 1989.
Summarise the information by selecting and reporting the main features, and make comparisons where relevant.
20 minutes, 150 words at least.
Please read another student’s answer HERE.
Solution
Changes in Average House Prices in Five Different Cities
The given bar chart present information on percentage changes in average house prices in different cities in New York, Madrid, Tokyo, Frankfurt, and London during years between 1990 and 2002 compared with average house prices in 1989. (The introduction is good if repetitions are removed. different cities = NY, M, T, F, L; during = between.)
Overall, the average house prices in five cities had wide fluctuations. The average price of house’s The prices decreased dramatic dramatically from 1990-1995 1990 to 1995 (from X to Y, between X and Y, during X-Y.) in New York, Tokyo, and London. From 1996-2002 During 1996-2002 the prices average price of house’s were (no need of a passive voice here) gradually increased in London, New York, and Madrid. (NOTE: Once you’ve mentioned “average house prices” at the beginning of the paragraph, you should not repeat it again. Use COHESIVE devices. A powerful cohesive device is “THE”. Prefer “the prices”)
The second and third sentences are not a part of the overall statement.
Overall, throughout the given period, the prices for Madrid and Frankfurt increased while those in Tokyo decreased. The prices first decreased and then increased in New York and London.
From 1990-1995 From 1990 to 1995 the average house prices (wrong tense) had grew 3% in Frankfurt and those in Madrid (Madrid did not increase, prices did) increased slightly by 2%. (those is a referencing device here. It refers back to “average house prices”.) Compared to 1989 the house prices in the Tokyo and London were (wrong voice) fell by to approximate 8%, those in New York decreased by to 5%.
From 1996-2002 From 1996 to 2002 the different average house prices scale was shows increased percentages (Strange sentence. Makes no sense.). In London the house prices rose to by 12%, it had developed to (the prices can not develop – wrong word choice) 5% in New York and grew to by nearly 4% in Madrid. (Organise the sentence: The prices in London rose dramatically by 12 percent and those in New York and Madrid increased slightly by 5 percent and 4 percent respectively.) In Frankfurt the house prices had experienced less increment and Least Frankfurt witnessed (experienced) the least increase in house prices. Finally in Tokyo house prices suddenly dropped to by 5%.
Follow this blog and like our Facebook page to learn exciting new essays and cue cards. You can contact me HERE.
Please subscribe to my Youtube Channel.
Contact me for writing a polished and effective Statement of Purpose.
Contact me for Editing Services and Document Writing Services.
