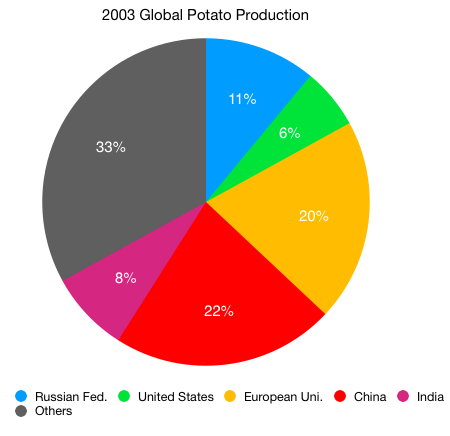
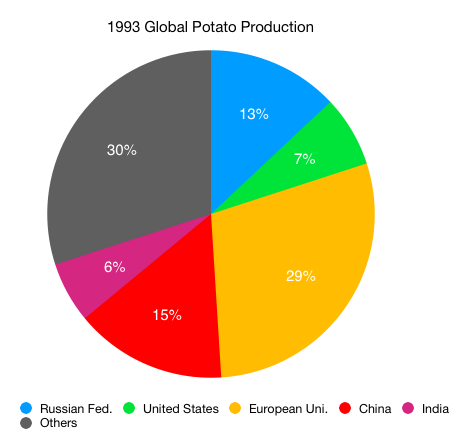
The charts below show production of potatoes in major regions of the world.
Summarise the information by selecting and reporting the main features, and make comparisons where relevant.


20 minutes, 150 words at least.
Answer: (NOTE: I can’t see 1983. You read a wrong year. A major mistake, indeed. There are only two years – 1993 and 2003.)
The pie charts present the changes in percentage production of potatoes in six areas across the globe from 1983 to 1993. Overall, European Union was the major producer of potatoes in 1983 which (was 1983 replaced by China? Which modifies the word it is connected to.) and it (refers back to the E.U) was replaced by the China a decade later.
In 1993, 1983, the European Union grew almost one-third of global potatoes followed by China, which accounted for 15% of the total. In next 10 years, the contribution of the former dropped by 9% while the later saw a growth of 7%.
Only 6% of total potatoes was were cultivated in India in 1993 1983 which and this rose by merely 2% in a decade. By contrast, the proportion of Russian Fed and USA dropped slightly from 13% to 11% and 7% to 6%, respectively in the mentioned time period. (You answer lacks main features. Please watch the video to learn about main features.)
The remaining countries categorized as ‘other’ and hold almost one-third growth of potatoes in both the years.
Follow this blog and like our Facebook page to learn exciting new essays and cue cards. You can contact me HERE.
Please subscribe to my Youtube Channel.
Contact me for writing a polished and effective Statement of Purpose.
Contact me for Editing Services and Document Writing Services.

