Investigating Students Conceptual Understanding of free fall motion and acceleration due to gravity
Abstract
We have developed a diagnostic test to investigate students conceptual understanding of free fall motion. The 15 multiple-choice test items are based on four basic concepts of free fall motion and acceleration due to gravity. Statistical tests were used for assessment of the data from the sample of diagnostic test. The result of data analysis shows that there are two basic concepts that are crucial for the understanding of free fall motion: the concept of constant downward negative acceleration and the concept of equal and opposite velocity at same height during upward and downward motion respectively. The results suggests that students are able to memorize the graphs of the physical phenomenon but have serious difficulty applying concepts while solving problem based on these concepts. Finally, we show how the test can be used as a diagnostic tool in a formative way and are useful for providing feedback for the students and for the teacher on kinematics concepts.
Keywords: Kinematics, Free fall, misconceptions, Fergussons Delta, biserial coefficient
Introduction:
Free fall motion is a real world example of straight line motion with constant acceleration in downward direction. Free fall describes a motion when gravity is the only force acting on the object and no other forces. This motion should be independent of the mass of the object. This is an excellent system to experiment with for studying the principles of kinematics.
Researchers have proved that free fall misconceptions are very common among the students (Kavanagh & Snider, 2006). It is an important concept of physics which can be addressed through kinematics, energy and force. If its graphical representations of the displacement versus time, velocity versus time, and acceleration versus time, are not understood correctly, students cannot use them for deductive reasoning of related cases scenarios like tossing the ball, projectile motion etc. (Wong, Sng, Ng, & Wee, 2011). Though students understand acceleration vs. time graph correctly, the displacement time and velocity time graph revealed complex misconceptions both on the physical phenomenon and its implicit mathematics consistency (Alicia M. Montecinos). Students develop personal theories of motion by generalizing the ideas they acquire from observation of objects in everyday situations (Keeports, 2000; McCloskey,
1983b). Traditional lecture method applied by most of the teachers does not consider the way students understand the concepts in physics – the students tend to believe whatever the teacher says. Teachers consider ones capabilities to solve difficult formula-based problems correctly in physics as a measure of students intelligence in physics concepts; they hardly give conceptual problems to students to analyze to see how well they understand them. (V. Antic, 2R. Hanson, 3E.R. Savelsbergh and 4H.M.C. Eijkelhof).The most common misconceptions are about speed of an object at the end of a free fall, which increases with its height of release and the final speed is independent of mass, at least for heights of release with which people are familiar. Most of the students believe that believe that heavier objects fall faster than lighter ones (Champagne, Klopfer & Anderson, 1980; Oberle et al., 2005, Rohrer (2002).
This study intends to investigate if the students who are taught free fall motion in classroom are able to interpret kinematical graphs and solve related problems.
Research Questions
To obtain data on conceptual understanding of free fall motion, following research questions were set for the study:
(1) Students ability to interpret verbal representations on free fall motion.
(2) Students ability to use kinematics equations to solve problems on free fall.
(3) Students ability to interpret graphical representations.
Materials and Methods
This study employed a multiple choice Diagnostic test in kinematics on free fall motion to collect responses from students. The study included a combination of qualitative and quantitative questions in the test – each item containing one right answer and three wrong alternatives, any of which could be chosen because of some prevailing misconception in understanding kinematics. The Diagnostic Test on free fall motion was a 15 items test composed of multiple choices based on the calculus-based undergraduate physics mechanics curriculum. The items in the test were selected from 20 items following expert opinion and on the basis of level of difficulty and the indices of defined differences.
The test is based on following concepts
- If an object is dropped (not thrown) from a height, then the initial velocity of the object is 0 m/s.
- If an object is thrown upwards in a perfect vertical direction, then it will slow down as it rises upward. The instant at which it reaches the peak of its trajectory, its velocity is 0 m/s.
- If an object is thrown upwards in a perfect vertical direction, then the velocity at which it is projected is equal in magnitude and opposite in sign to the velocity that it has when it returns to the same height.
- An object in free fall experiences an acceleration of -9.8 m/s/s. (The – sign indicates a downward acceleration) throughout the motion.
- Motion in freefall is independent of mass of the object.
- Average velocity between two positions in constant acceleration motion is the velocity at mid time.
Subjects
The respondents for this study were first year undergraduate students of physics class with mathematics background from two different colleges affiliated to Savitribai Phule Pune University in the academic year 2013-14. The total number of students selected from these colleges was 100.
Statistical Evaluation of the test
Item statistical analysis is used to examine the students responses to individual test items in order to check the quality of those items and of the test as a whole. Five statistical tests were used for assessment of the data from the sample. The following statistical tests were applied:
- For individual test items (questions):
- Item difficulty index
- Item discrimination index and
- Item point biserial coefficient
- For the complete test:
- Kuder-Richardson reliability index and
- Fergusons delta
(Ding et. al., 2006; Day and Boun, 2011).
Item difficulty index (P)
Item difficulty Index (P) is the measure of difficulty level of single test item. For items with one correct alternative worth a single point, the item difficulty is simply the proportion of the students who answer a test item correctly. It is calculated by the formula,
P = 
where N1 is number of correct responses on the item and N is the total number of students attempted the item. The formula of average item difficulty index is,
P = 
where K is the number of items in the test.
The possible range of item difficulty index (P) is [0, 1]. The item difficulty indices of the test are shown in Figure 1. The average item difficulty index is found to be 0.395249 which is greater than 0.3. 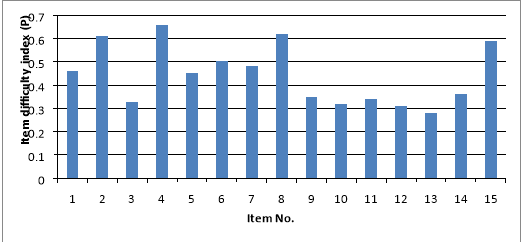
Figure 1.Item difficulty index (P) for each question, based on a sample of 100 students.
Item discrimination index (D)
Item discrimination is used to assess the ability of an item to differentiate among students on the basis knowledge of the material being tested. In order to calculate the item discrimination index D, the students were divided into two different groups of equal size, a high group (H) and a low group (L), based on whether an individual total score is higher or lower than the median total score of the entire sample and it is calculated by the formula,
D = 
Where NH is number of students in high group who responded the item correctly and NL the number of students in low group who responded to the item correctly, out of N students who attempted the item. The average item discrimination index is calculated by,
D = 
Below figure shows the item wise discrimination index.
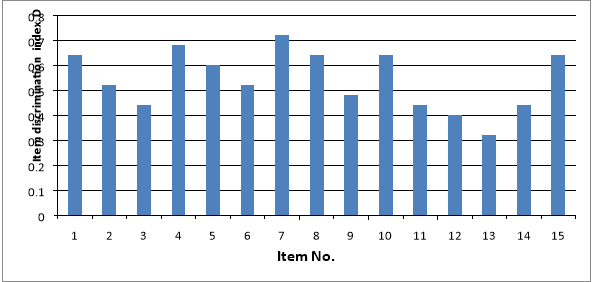
Figure2. Item discrimination indices for each question, based on a sample of 100 students.
Point biserial coefficient (rbps)
A point-biserial coefficient is a correlation coefficient and is a measure of consistency of a single test item with the entire test. The point
biserial coefficient for an item is calculated by the formula
rbps =
where
 is the average total score for the whole sample,
X1 is the average total score for those students who correctly answer this item,
 is the standard deviation of the total score for the whole sample,
P is the difficulty index for the item.
The average point biserial coefficient (rbps ) of all items (K) in a test is
rbps = 
The biserial coefficients for the test are shown in the Figure 3.
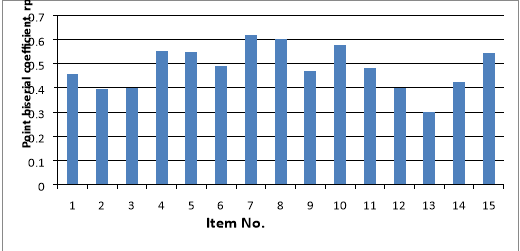
Figure3. The item biserial coefficient for each question, based on a sample of 100 students.
Kuder-Richardson reliability index
Kuder-Richardson reliability index is a measure of internal consistency
(reliability) for measures with dichotomous choices. Values can range from 0.00 to 1.00 (sometimes expressed as 0 to 100) – a high value indicates a strong relationship between items and a lower value a weaker relationship. The KR-21 may be affected by difficulty of the test, the spread in scores and the length of the examination.
The Kuder- Richardson (KR-21) formula is given as
r =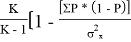

Reliability coefficients are related to the level of discrimination of the test items and to the number of test questions. Values can range from 0.00 to 1.00. The reliability index is higher than 0.8, it is reliable for individual measurement. The reliability index of 0.701527 for the test indicates that the test is a reliable test.
Fergusons delta
Discriminatory power can be measured by Fergusons delta. The Fergusons delta is calculated by the formula
=
where N is the number of students in a sample, K is the number of test items, and fi is the frequency (number of occurrence) of cases at each score.
If a test has Fergusons delta greater than 0.9, the test is considered to offer good discrimination. The present test has a Fergusons delta score of 0. 967723.
Table1. Overview of statistical results of the test
| Test statistics | Range of Possible values | Desired values | Value for the test |
| Item difficulty index (P) | [0,1] | > 0.3 | Avg. 0.444346 |
| Item discrimination index (D) | [-1,1] | > 0.3 | Avg. 0.541333 |
| Point biserial coefficient (rpbs) | [-1,1] | > 0.2 | Avg. 0.483904 |
| KR-21 test reliability (r) | [0,1] | > 0.7 or > 0.8 | 0.701527 |
| Fergussons delta () | [0,1] | > 0.90 | 0.967723 |
Discussion. The aim of this study is to use a diagnostic test to explore the student’s qualitative as well as quantitative understanding of concepts of free fall motion and gravity.
Students responses showed that only *** students were able to understand kinematics graphs of free fall motion. Students seems to mix up the velocity versus time graph with the shape of the path of the object, they try to recreate the shape of the path. When asked to draw a graph of an object thrown downward from some height and it bounces and caught at a height below the starting point, about *** students probably understood the point of discontinuity in the velocity but they did not have the concept of direction as against *** students who partly interpreted the initial motion correctly but has not understood the result of elastic collision, Most of the students were not seemed to confuse with the direction and change in magnitude of velocity of a freely falling object. The response shows that many students have a misconception that velocity of the object becomes zero after it touches the ground, as it stops at the end of motion. Most of the student considers only magnitude and not the direction of the velocity. Some of the students have chosen the option of constant velocity, probably because acceleration is constant. When the object is thrown vertically upward and the students are asked to find the magnitude of velocity at the highest point, the students response shows that they are confused with the meaning of free fall, they consider that free fall means only the downward motion. About *** students responded that the velocity of the body in free fall depends upon the mass of the object, the result shows that most of them expect heavier object to fall faster based on their experience, not realizing that the condition for air friction is dropped. Some of the students believe that the heavier object will take half the time because its mass is double the mass of lighter object. Some students thought intuitively that the same force is applied so lighter will move faster and since the mass is half so it will take half the time.
To probe students understanding of the magnitude and direction of gravitational acceleration in free fall motion. Only *** students responded correctly. The students responses indicated that many of them believed that acceleration is always in the direction of motion. It is +9.8 m/s2 in upward direction and -9.8 m/s2 in the downward direction. About *** of the students responded incorrectly to the question based on misconception that freely falling bodies can only move downward. It is observed that students have difficulty to understand the direction and magnitude of initial velocity graphically when it is dropped from a moving body.
Students responses on problems in the test corroborated the finding that a majority of the students were unable apply kinematics equations of motion effectively in problem solving. average velocity between two positions in constant acceleration motion is the velocity at mid time. Discussion with the students found that the difficulties in understanding of concept of free fall motion
Conclusions
The aim of this study was to examine students understanding of free fall motion concepts. We have designed a test to assess students conceptual understanding of free fall motion at undergraduate level. The average item difficulty index, average item discrimination index and average item point biserial coefficient was calculated which was shown in Table 1 for item analysis. These results indicate that test is sufficiently reliable item wise. The test reliability and Fergusons delta was calculated which is shown in table 1 for entire test. These results indicate that test is sufficiently reliable as whole test. The results of the test are indicative of a lack of conceptual mastery amongst undergraduate students of basic kinematics concepts for constant acceleration motion, particularly kinematics graphical interpretation. It is necessary to use interactive teaching methods for proper understanding of these concepts (Coca, 2012). Microcomputer based laboratory (MBL), computer simulations, animations and demonstrations may be useful in these respects. Physics educators should use these tools for interactive learning. Misconception that at the highest points the acceleration is zero because velocity is zero
References:
1V. Antwi, 2R. Hanson, 3E.R. Savelsbergh and 4H.M.C. Eijkelhof Students Understanding of Some Concepts in Introductory Mechanics Course: A Study in the First Year University Students, UEW International Journal of Educational Planning & Administration.Volume 1, Number 1 (2011), pp. 55-80
Champagne, A. B., Klopfer, L. E., & Anderson, J. H. (1980). Factors influencing thelearning of classical mechanics. American Journal of Physics, 48, 10741079.
Oberle, C. D., McBeath, M. K., Madigan, S. C., & Sugar, T. G. (2005). The Galileo bias: Anaive conceptual belief that influences peoples perceptions and performance in aball-dropping task. Journal of Experimental Psychology: Learning, Memory, andCognition, 31, 643653.
Rohrer, D. (2002). Misconceptions about incline speed for nonlinear slopes. Journal of Experimental Psychology: Human Perception and Performance, 28, 963973.
Vasudeo Digambar Kulkarni, Popat Savaleram Tambade, Assessing the Conceptual Understanding about Heat and Thermodynamics at UndergraduateLevel. European J of Physics Education Vol.4 Issue 22013
Keeports, D. (2000). Addressing physical intuitiona first day event. The Physics Teacher, 38, 318-319.
McCloskey, M. (1983a). Intuitive physics. Scientific American, 248(4), 114-122.
McCloskey, M. (1983b). Naive theories in motion. In D. Gentner & A. Stevens (Eds.),Mental Models (pp. 299-324). Hillsdale, NJ: Lawrence Erlbaum Associates