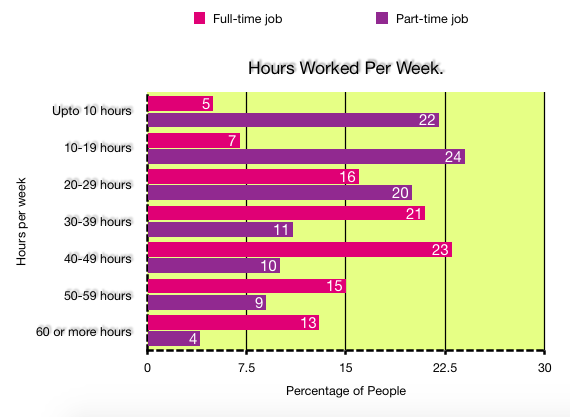
The chart shows hours worked per week in the United Kingdom in 2010.
Summarize the information by selecting and reporting the main features and make comparisons where relevant.

Answer:
Please read the sample answer HERE.
The bar chart represents presents data about various percentages of part-time and full-time workers according to their number of working hours per week in the United Kingdom in 2010.
Overall, the majority of part-time employees worked for 10 to 19 hours in a typical week whereas the largest percentage of full-time workers had a work of was employed for 40 to 49 hours per week.
The majority of full-time job holders with 23 percent worked for around to 40 to 49 hours per week and these were closely followed by employees with work of for 30 to 39 hours and those with 20 to 29 hours of work per week. A significant proportion of individuals with 15 percent of employees worked for 50 to 59 hours. The least number percentage of the full-time working population with 5 percent was engaged in work for 10 hours per week.
In part-time job category, the maximum number percentage (proportion) of people with 24 percent preferred to work for 10 to 19 hours a week followed by individuals with work up to 10 hours per week and those with 20 to 29 hours job work. Almost every tenth part-time employee worked for 30 to 39 hours, 40 to 49 hours and 50 to 59 hours. The least number percentage of individuals with 4 percent had a work of 60 hours or more per week.
Follow this blog and like our Facebook page to learn exciting new essays and cue cards. You can contact me HERE.
Please subscribe to my Youtube Channel.
Contact me for writing a polished and effective Statement of Purpose.
Contact me for Editing Services and Document Writing Services.

